Methodology
This section provides a detailed explanation of the methodology employed in the computation of Occupancy Classification (OC). It encompasses both the dataset properties and the various steps involved in deriving occupancy predictions.
Properties
1. Monthly consumption
The Electricity and Water datasets comprise of monthly meter readings obtained from SP Services (SPS). While the monthly aggregates do not provide precise information about occupancy on specific days, they offer estimations of long-term occupancy trends over extended periods.
2. Account based
The collected meter readings are categorised based on utilities accounts. With the introduction of Open Electricity Market, premise addresses no longer have a one-to-one direct correspondence with a single utilities account. In many cases, multiple accounts can be linked to a single property.
In the figure below, observe how an occupant has switched their utilities provider from SP services to an OEM retailer. (Different colours represents different account numbers)
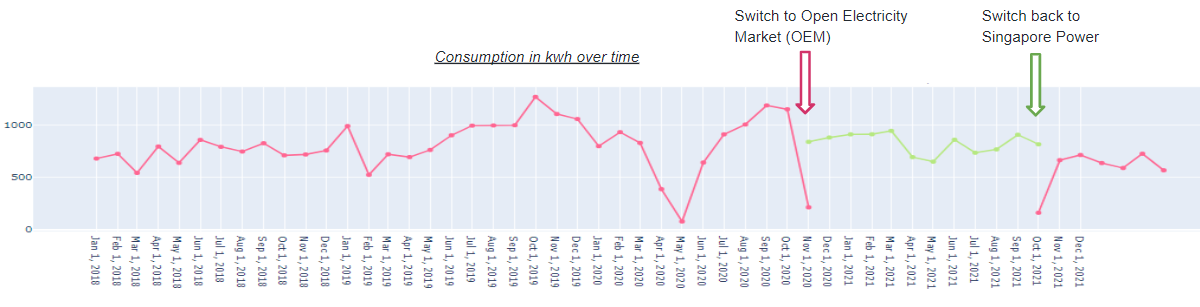
It is important to note that if the usage from the OEM retailer is excluded or fails to be associated correctly, the insights derived from the data could suggest zero consumption between November 2020 to October 2021. This highlights the significance of capturing all associations to the premise in order to accurately infer usage patterns and occupancy trends.
Activity Score
The Activity score is a metric used to distinguish between occupied and vacant premises. It provides a quantitative measure that indicates the level of confidence in predicting the occupancy status of a property.
A high confidence level in occupied predictions will result in an Activity Score close to 1, indicating a strong likelihood of the premises being occupied. On the other hand, vacant premises will have an Activity Score of 0, indicating a high certainty of the property being unoccupied.
The Activity Score serves as a valuable tool for assessing the occupancy status and also the prioritisation of premises to visit based on the occupancy or vacancy preference.
Find the score associated to every unique building entity for every month, as follows: 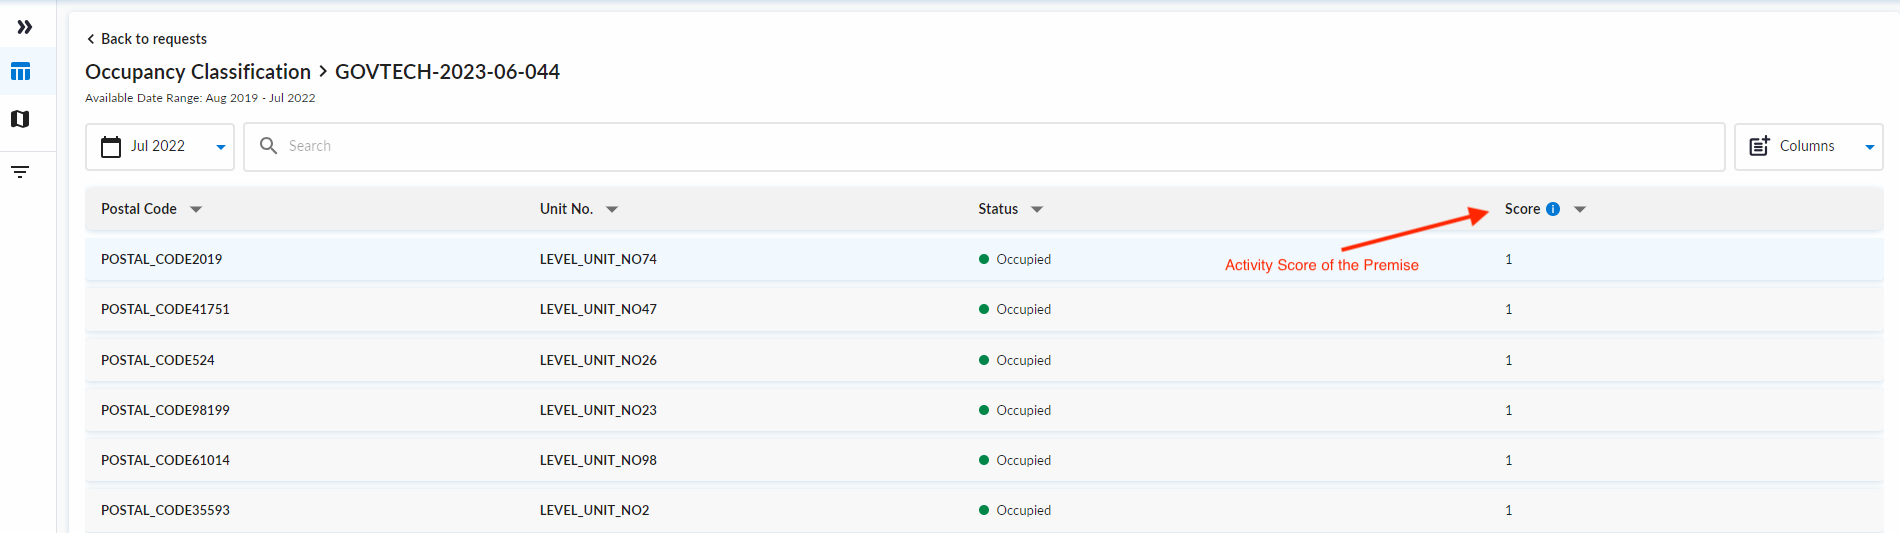 Information redacted. Provisioned tables will contain actual values of building information and activity score.
Multi-Criteria Decision Making
For the computation of the Activity Score, a multi-criteria approach is incorporated to identify meaningful relationships found within the data. This comprehensive method factors in the various aspects that contribute to occupancy patterns, allowing for a more accurate assessment of the occupancy status.
These are 3 criteria that are taken into consideration:
Criterion 1: Percentile rank within Premise
Q: Is utilities usage in the latest month “normal” vs its historical baseline? 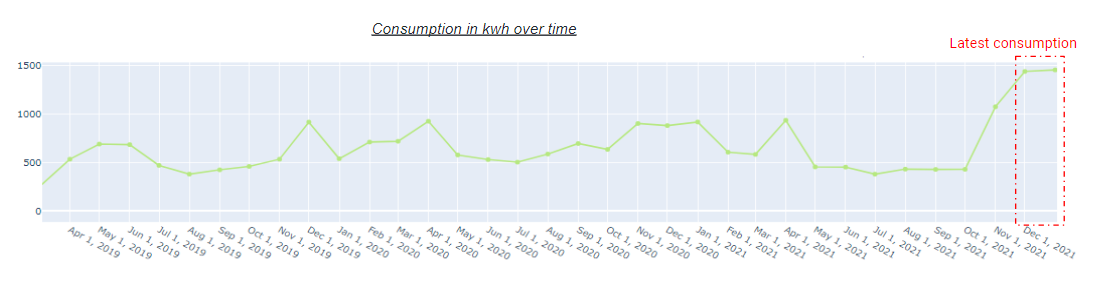
By analysing a single premise with its historical trend, it can denote how the the latest consumption patterns fare in comparison with its past consumptions. If the consumption show an all-time-high in the latest month, it shows that the premise is most likely more occupied than ever, and would be wise to pay a visit to the premise as opposed to the other months.
Criterion 2: Percentile rank across Premises
Q: Is normalised utilities usage higher vs other premises?
Comparing the operational size is also important. One premise is operating at large capacity, the other is operating at small capacity. It is easier to tell that the large premise is active when compared to the small premise, since any decrease in consumption will be obvious. The higher operating capacity also signifies higher chance of occupancy, given there is more activity going on / utilities consumed at the premise.
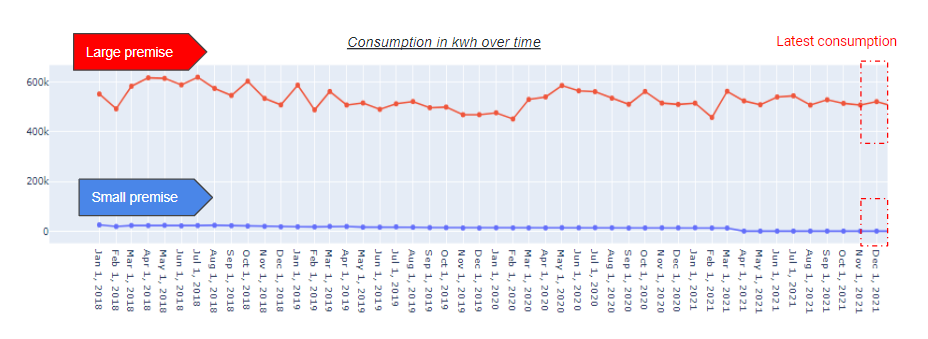
However, to avoid instances where there are huge fluctuations which spikes only in the recent months, normalisation is applied to cater for preference in consistent and large operational capacity over others.
Criterion 3: Ratio within Premise
Q: How much more/less does utilities usage differ against a reference period (eg. Covid-19 lockdown period)?
Contextual information can be very useful to decide how occupancy patterns are influenced, for example by a significant event like Circuit Breaker. Non-essential services and residential premises have seen large changes in trends and patterns since COVID-19. Such information help us identify a reference point and baseline to denote what consumption figures are like during vacancy or maximum occupancy.
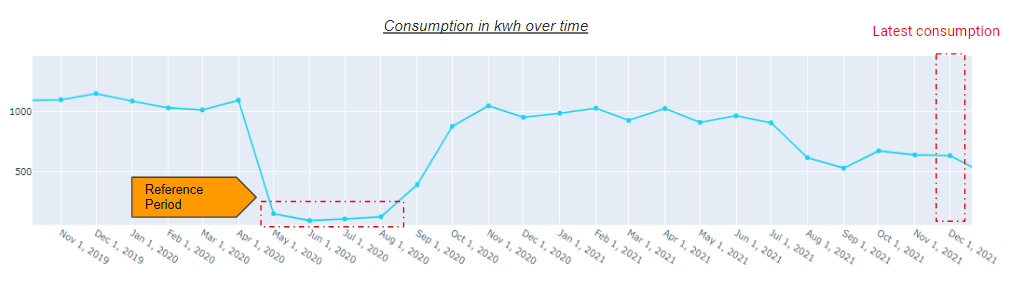
As seen in the figure above, which belongs to a commercial premise, the latest consumption patterns show a significant increase from its reference period, which demonstrates the minimal consumption that signifies vacancy. Thereby, any consumption slightly higher than the reference period should be treated as non-vacant.
Note: Criterion 3 may exhibit bias towards premises that are unaffected by the specified reference period. Premises that are not impacted by this specific period may not receive an optimal rating for this criterion. If your premise of interest does not fall within the influence of the default significant event, please modify the reference period accordingly to fulfill this criterion.