Overview
Data visualisation is a feature that allows users to preview privacy-protected and aggregated data.
It is currently only available for datasets in Trusted Center for Sensor Data (TCS) for the following consumption datasets: PUB water, EMA electricity, EMA towngas.
Use cases
As a user, you can achieve the following goals with this feature:
- Get a sense of our datasets before making an actual data request for more complex data requirements.
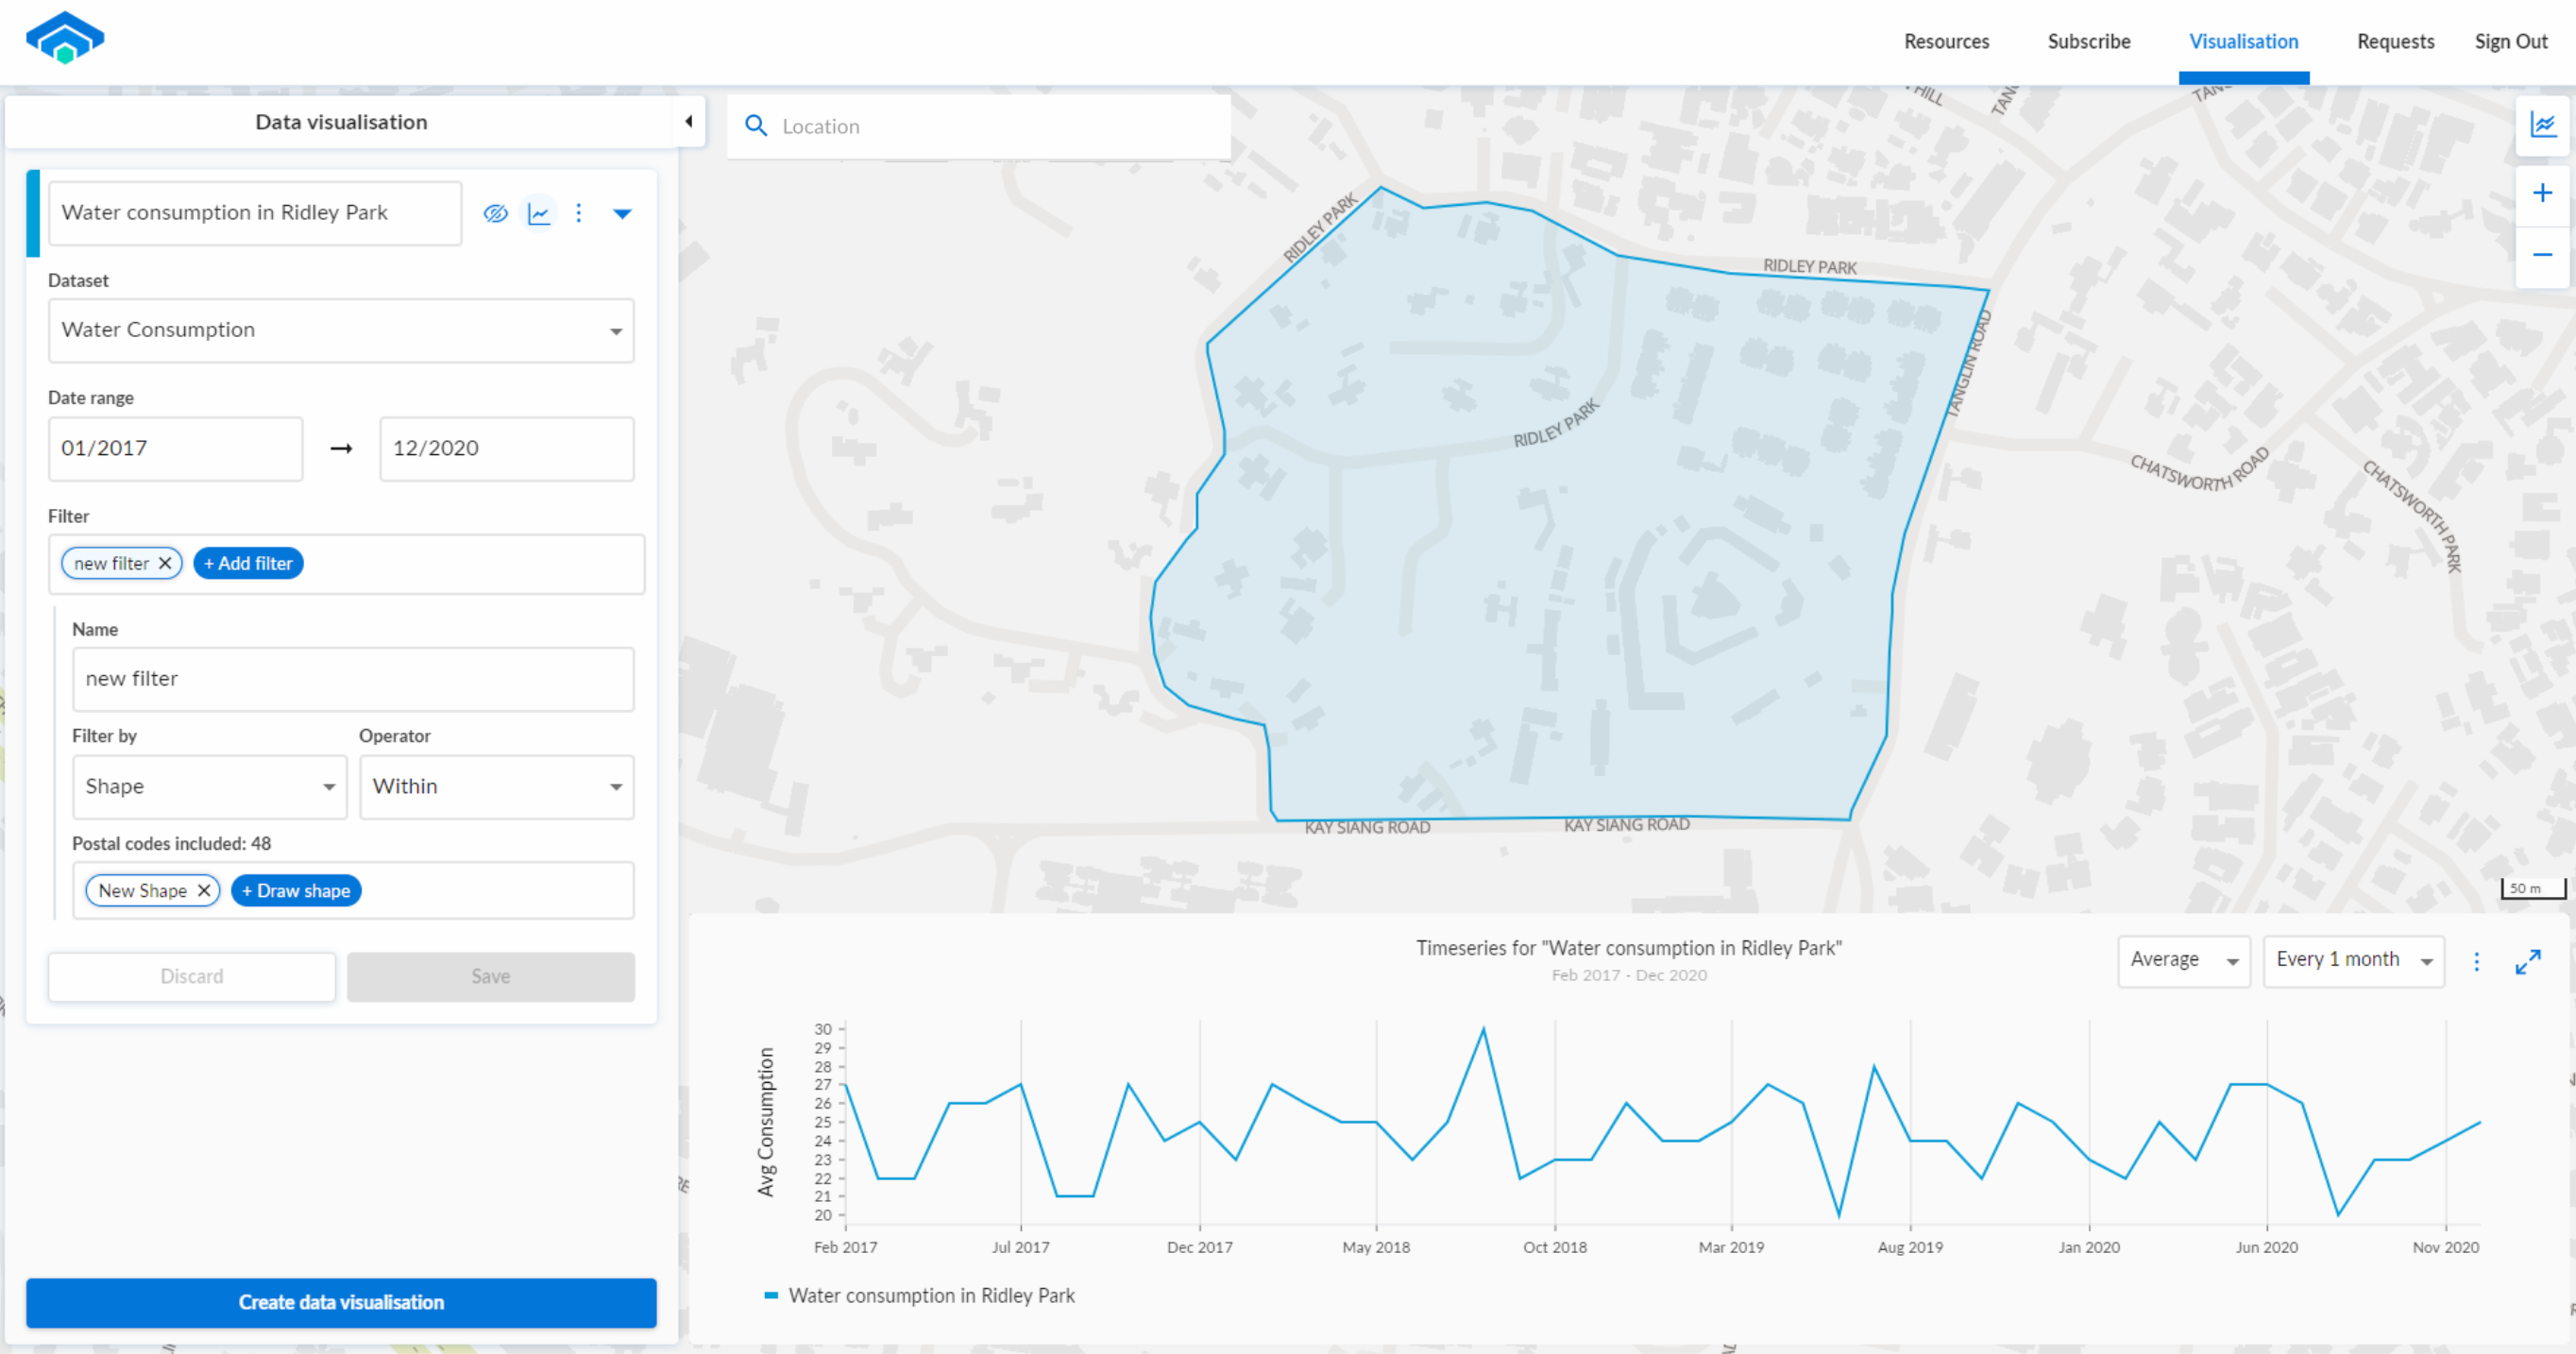
- Visualising a consumption trend over a user-defined area.
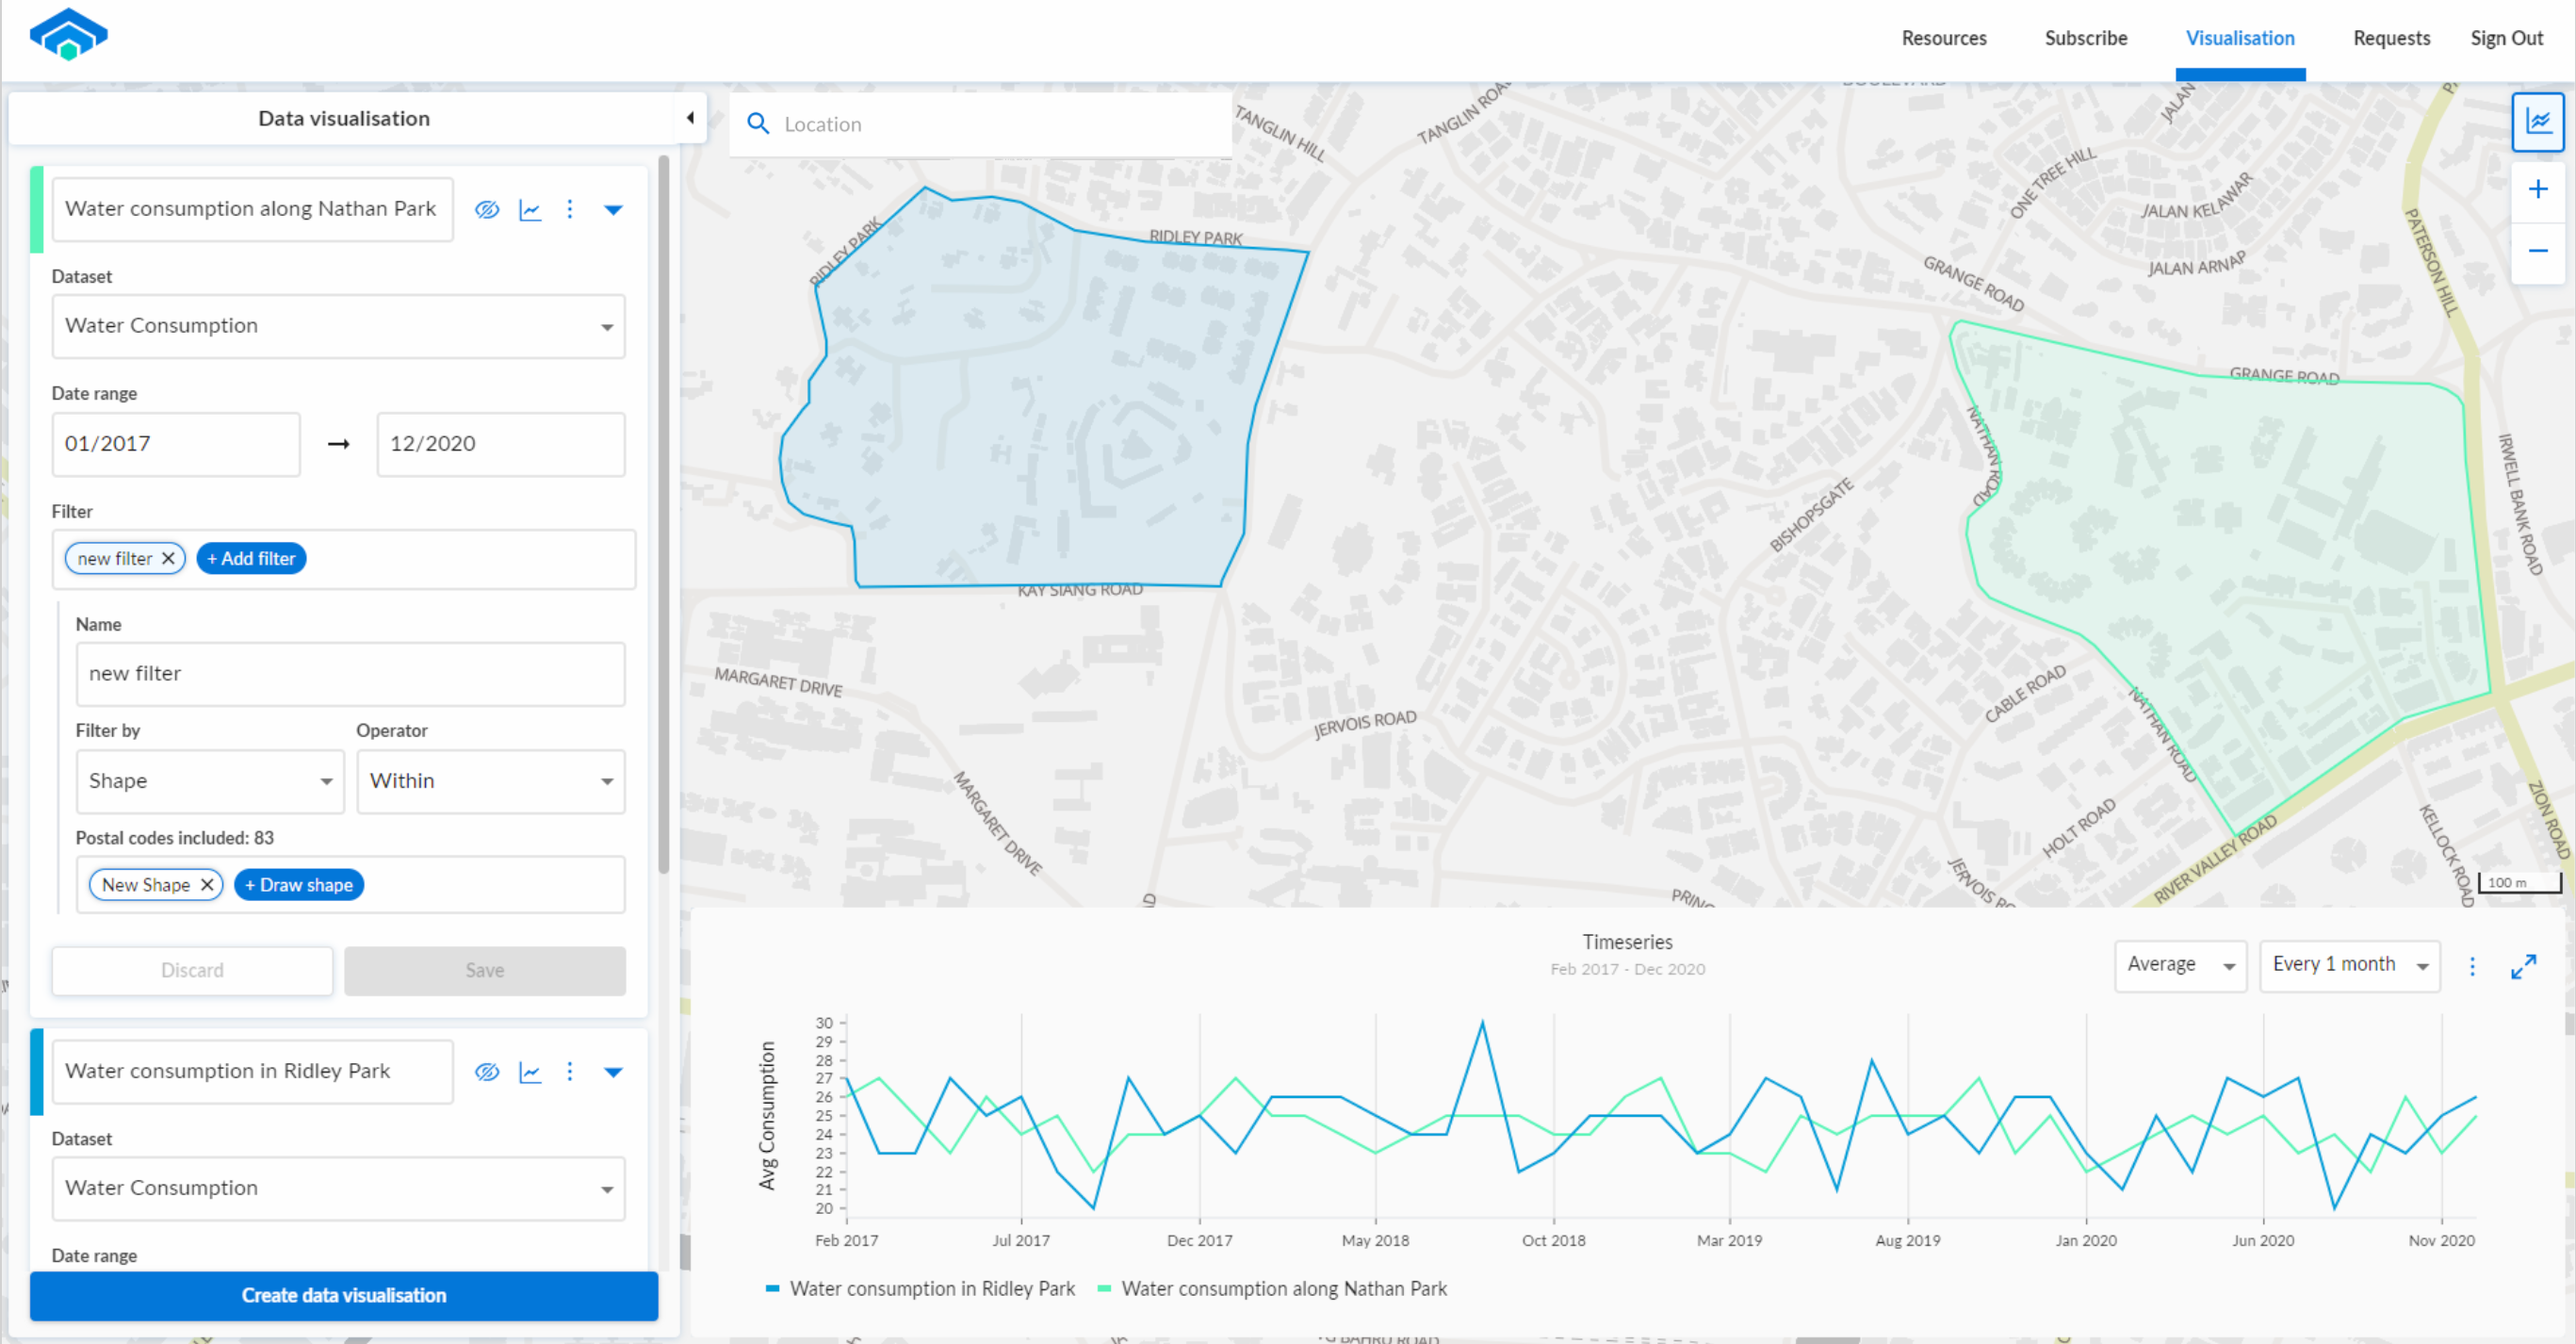
- Comparing consumption trends across different segments of user-defined areas.
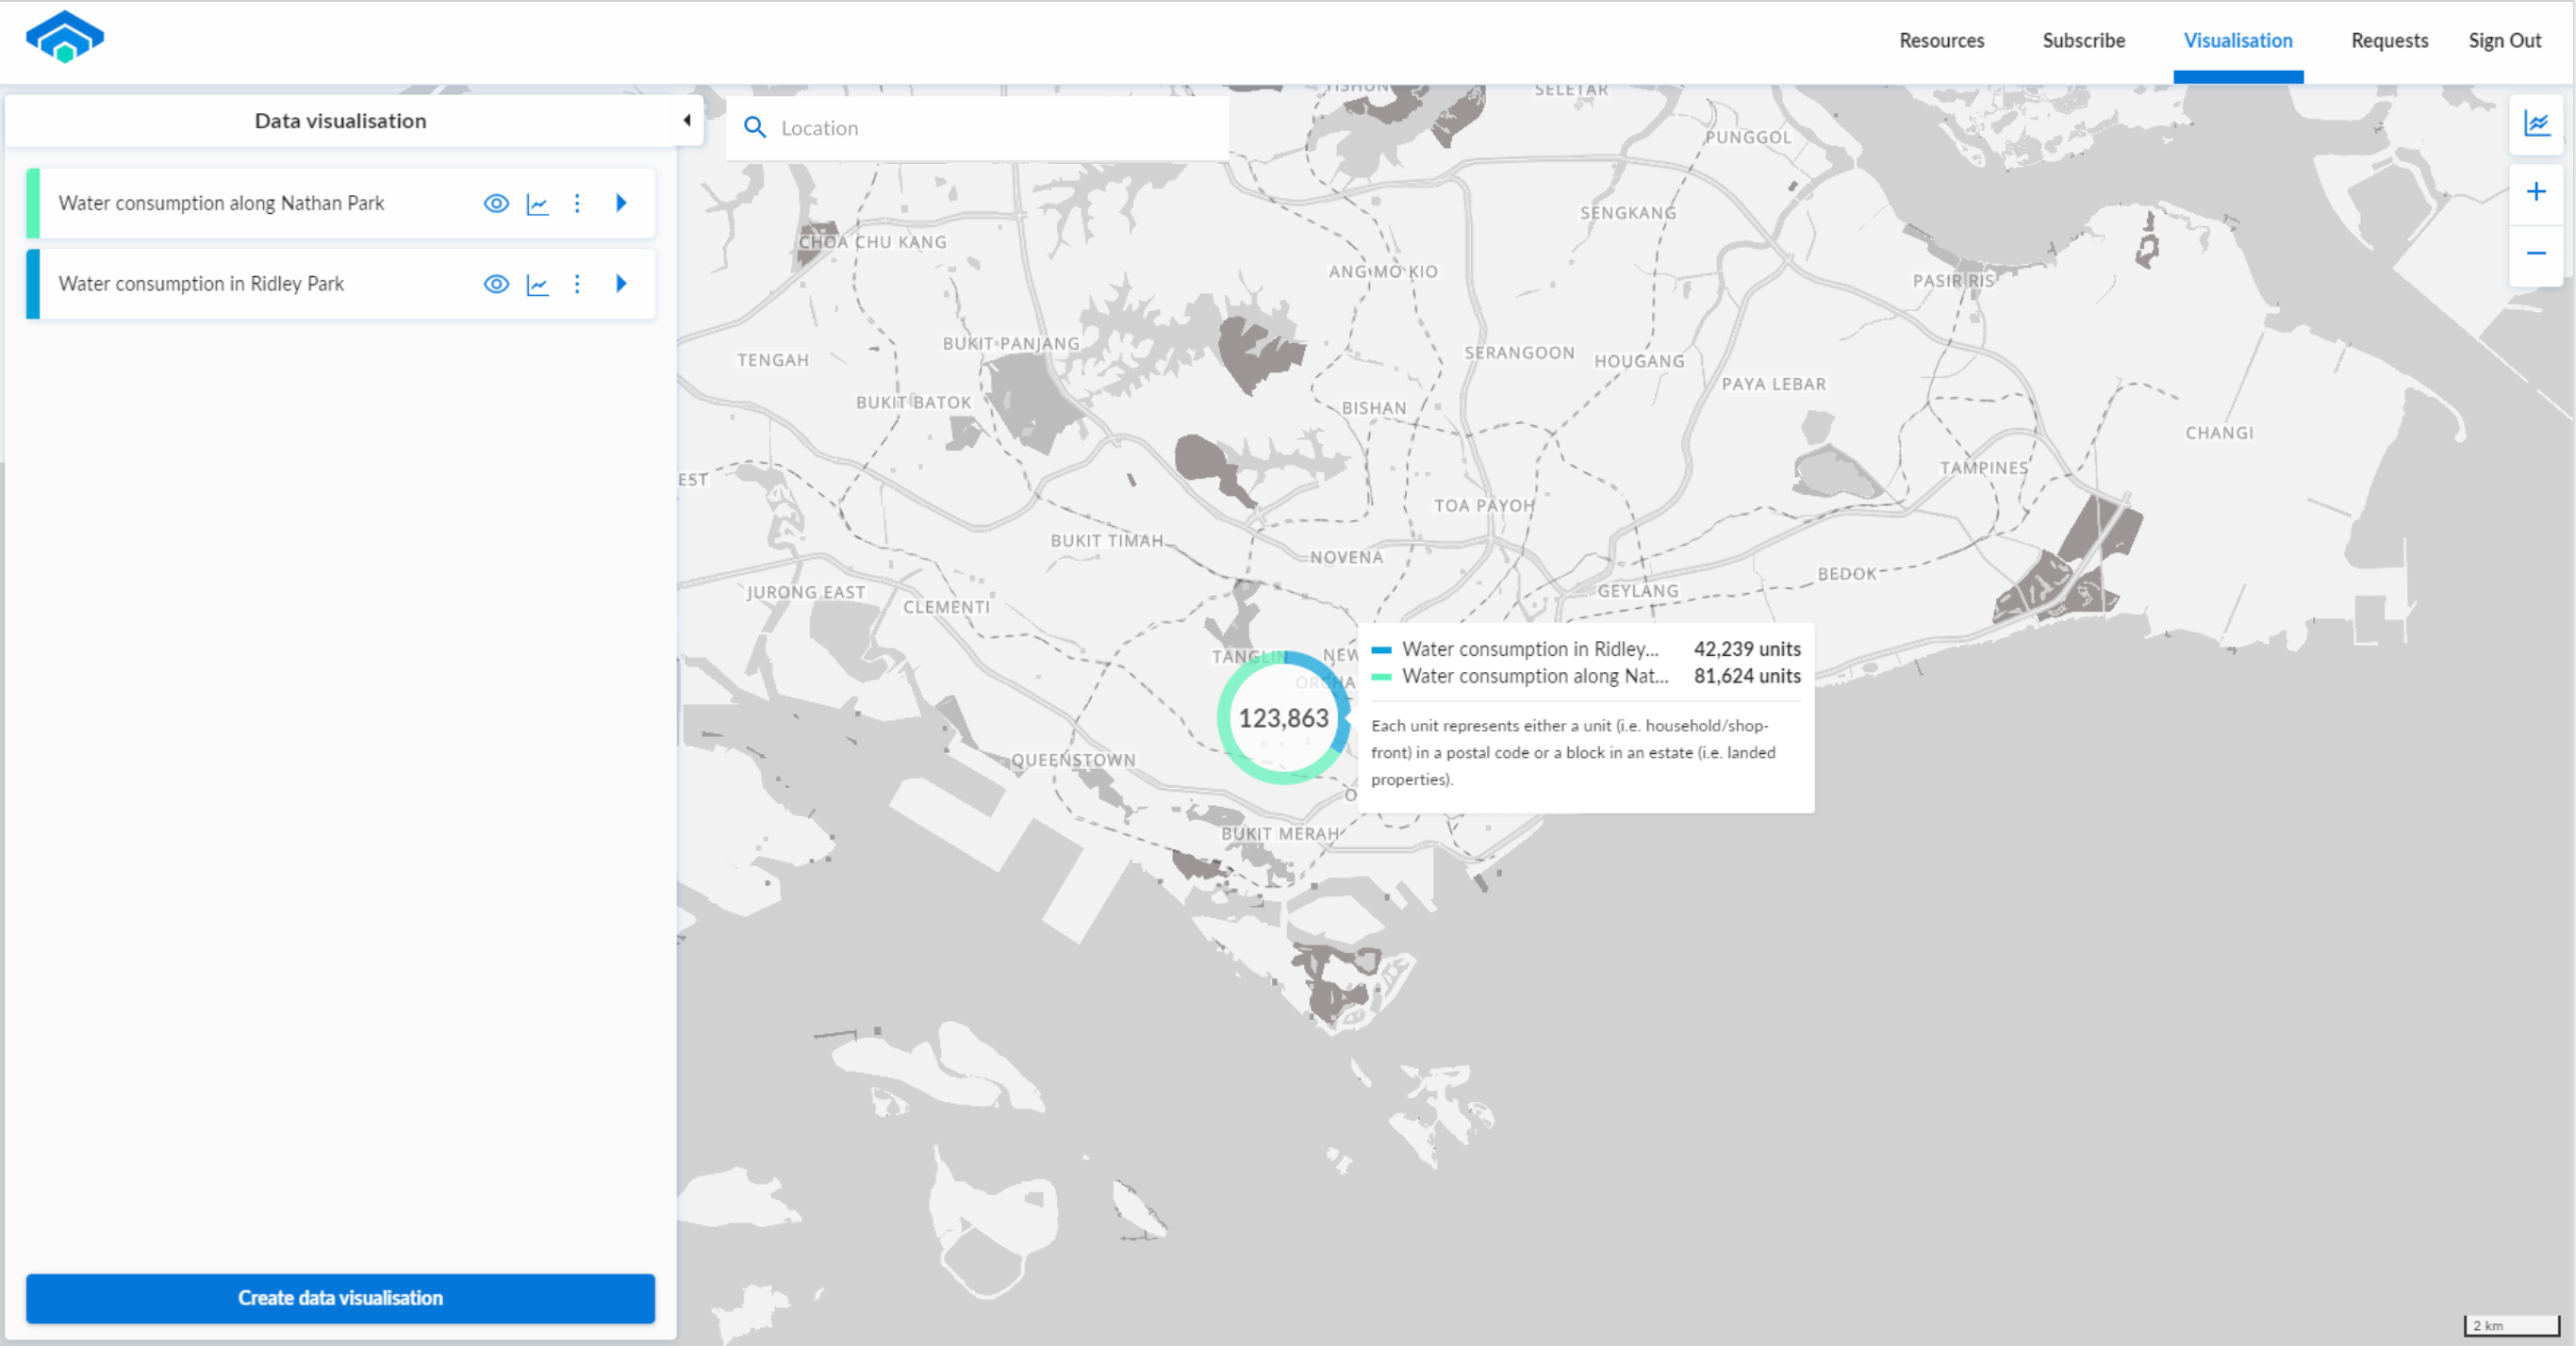
- Compare the density of consumption account units in the area.
Getting access to data visualisation
Login using your WOG Entra ID account (SOE ID) and click on the “Visualisation” button on the top navigation bar. 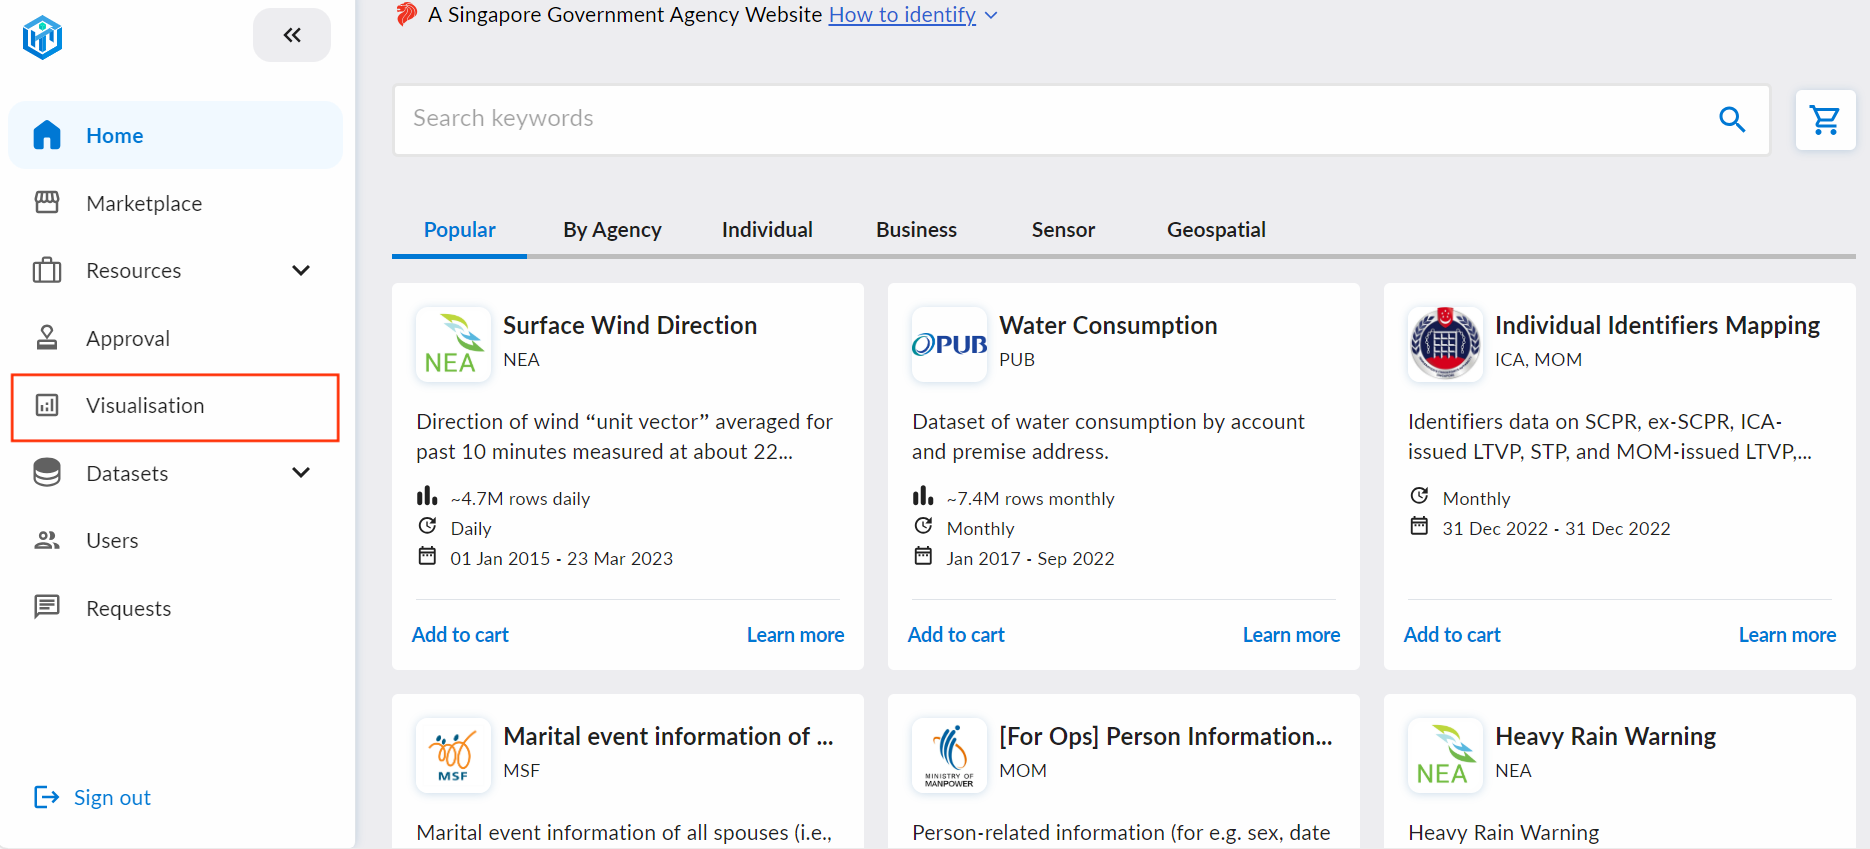
System requirements
On top of the existing system requirements required to access the DataHive platform, we recommend users to have a screen resolution of at least 1024 x 768.